Projects
The great hall of projects, big and small.
Google Data Analytics Course Capstone: Cyclistic Bike-Share Analysis
Date: September 2023
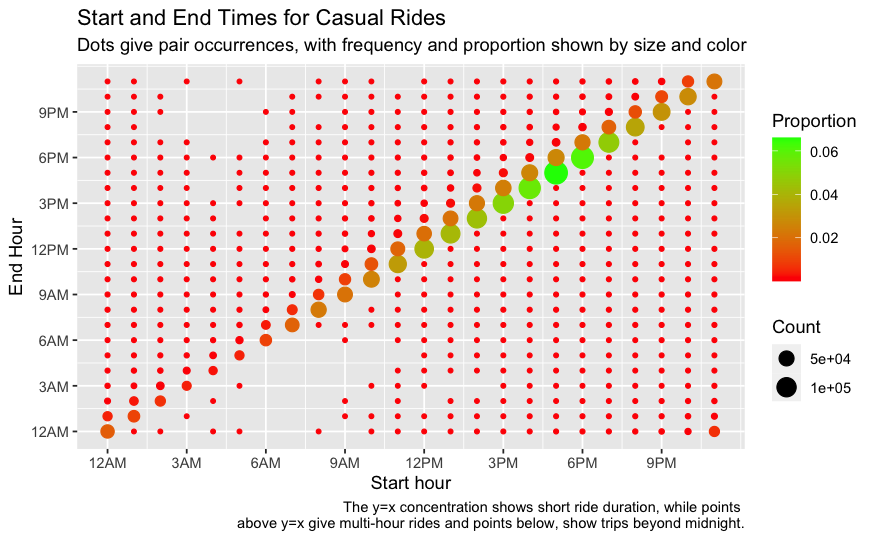
A rather unusual plot I created for examining occurrences of bike ride hour start and end pairs, in trying to understand the differences between casual riders and Cyclistic members.
I recently completed Google’s excellent Data Analytics Certificate program on Coursera, which covers a lot of material - spreadsheets, SQL, Tableau - and a subject close to my heart, the R programming language. Completing a “capstone project” is an optional part of the course, but never one to turn down a fun challenge, I decided to take the plunge and tackle one of the offered business challenges. Clicking on the title above will bring you to my hosted R Notebook with my full, end-to-end reproducible data analysis workflow, from initial questions to cleaning, analysis and conclusions. If you’d like to check out the associated repository, you can click here.
In this scenario, the task was to understand differences between casual riders (those who buy a single ride or day pass) and membership riders for a fictional company, Cyclistic, and draw conclusions for what additional data might be needed or what actions could be taken in preparation for a campaign to convert casual riders to members. In practice, the data used for this scenario was that of Divvy’s Chicago bike-sharing data, and I chose to examine the last full year of data, 2022, which constituted over 5 million rows. Given this amount of data, SQL would have been a great choice - and I may yet revisit an alternative take on the project using SQL - but I figured I would put some of my new-found tidyverse skills to the test in R, and it was a great experience.
Easy21
Date: February 2023
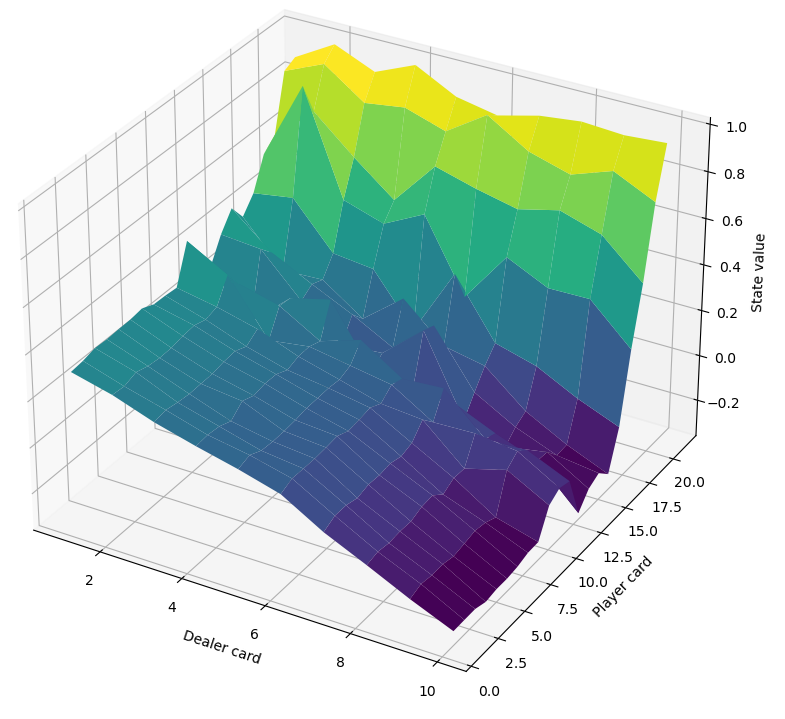
The value function learned via Monte Carlo control for the Easy21 game (a blackjack derivative), where the back of the plot intuitively corresponds to high value states where the player has a high sum and the dealer will need to hit multiple times to come close and hopefully (for the dealer) not go bust in the process.
When I did an independent study in reinforcement learning (RL), I watched my way through David Silver’s famous and excellent course on RL on YouTube. At the time I did some other small projects to get hands on experience with implementing RL algorithms, and so I filed away the Easy21 assignment he assigned in that course for revisiting. More recently, wanting a refresh on RL and a fun project for myself, I took on implementing a solution to the assignment in Python and was reminded of why RL can be so fun: watching your agent learn how to comprehensively contend with an environment is just so compelling. Sure, the challenge wasn’t on the order of Go but it’s fun to see what you can get up to with a little Python and a laptop.
Multi-aRmed Bandits
Date: January 2023
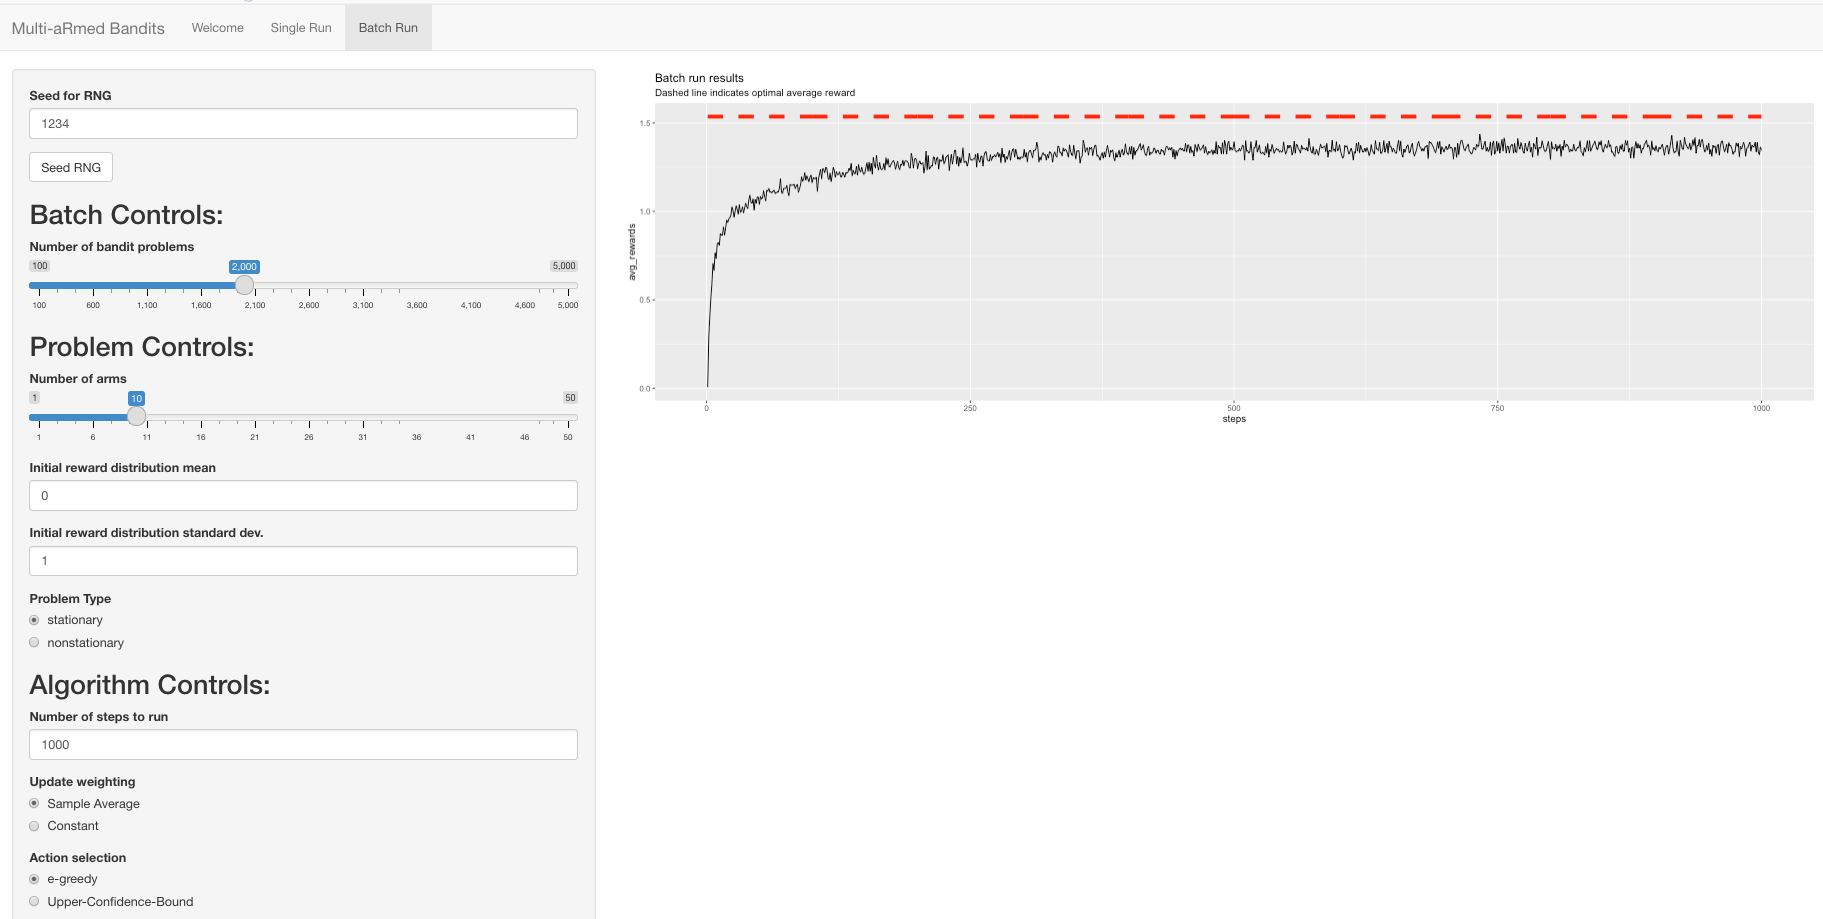
A sample of my R shiny interface being used to recreate one of the bandits evaluations from the venerable Sutton and Barto Reinforcement Learning (2nd ed.) book.
After a semester absorbed with simulation and completing my thesis, which revolved around Bayesian networks and discretization, I wanted a refresh on reinforcement learning (RL) and figured I could quickly skim my way through Richard Sutton and Andrew Barto’s “Reinforcement Learning” (2nd ed.). I distinctly remember enjoying the second chapter when I first read it in an independent study, as it does a nice job of building you up to understanding the “full” RL problem context, and introducing you to ideas of exploration and estimates. Fresh from my thesis work where I had used the straightforward but powerful R shiny package to make an interface for working with Bayesian networks, I figured why not pop 2 balloons with one stone (leave the birds alone!) and get my RL refresh while sharpening my R / shiny skills. With this in mind, I made a demo GUI with which anyone could tinker and either re-create some of the experiments shown in the book or work on their own to see how the selected learning approach (estimate updates, action selection, and optimistic values) fairs in different problem contexts (stationary or non-stationary, number of arms, reward means and variances). Once again the shiny package made it fun to create a nice little interface, and R and ggplot2 (for plotting) are always satisfying.
Agent-Based Modeling of Controlling Urban Outdoor Cat Populations
Date: December 2022
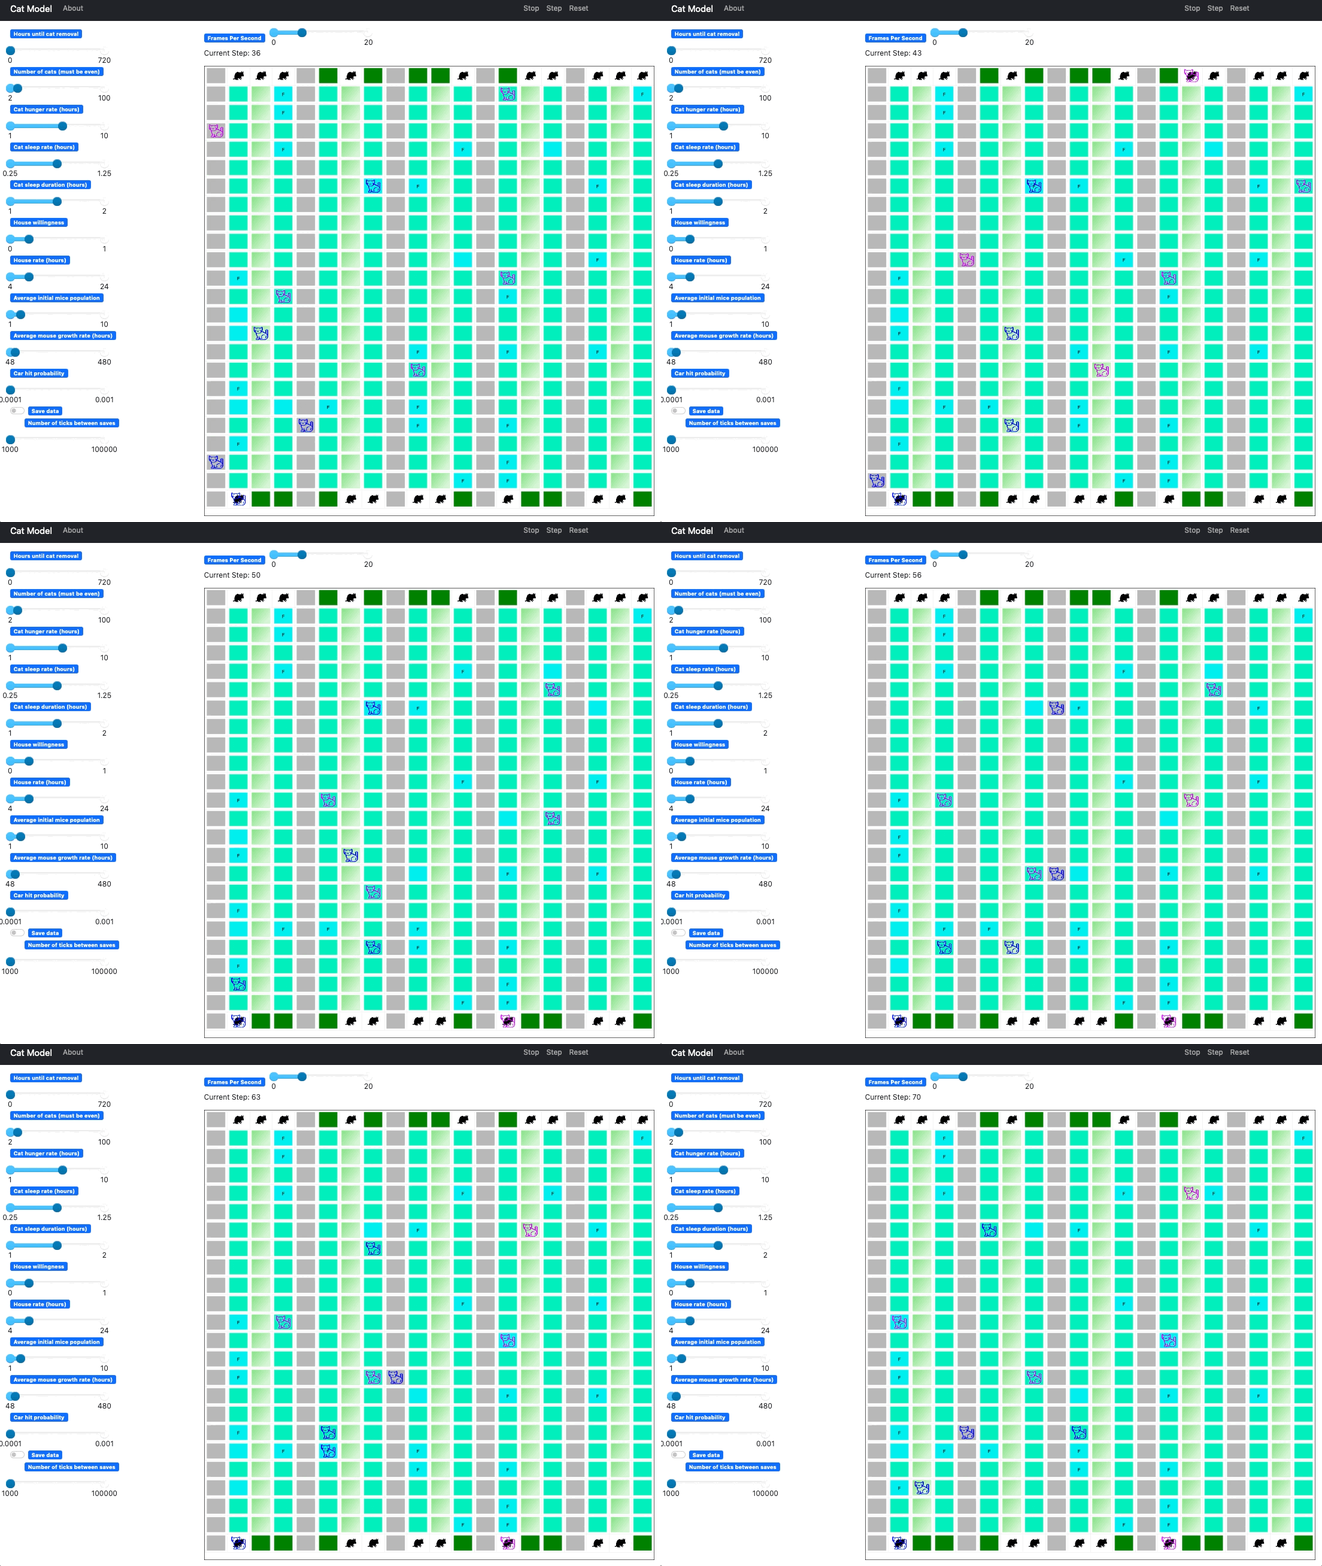
The visual browser-based interface of our cat simulation. On the right is the simulation space designed to approximate roughly five blocks in an urban residential area as might be found in Brooklyn or Queens, New York, with streets full of houses nestled between avenues with commercial areas. On the left, there are a number of sliders which offer control over simulation parameters, including the frequency with which cats are “removed” from the environment.
When it came time for my friend Artjom and I to pick a project for the modeling and simulation course, the kitten I took in earlier in the semester (found abandoned, yelling his little head off under a van parked on the street) kindly stepped in to suggest a topic.
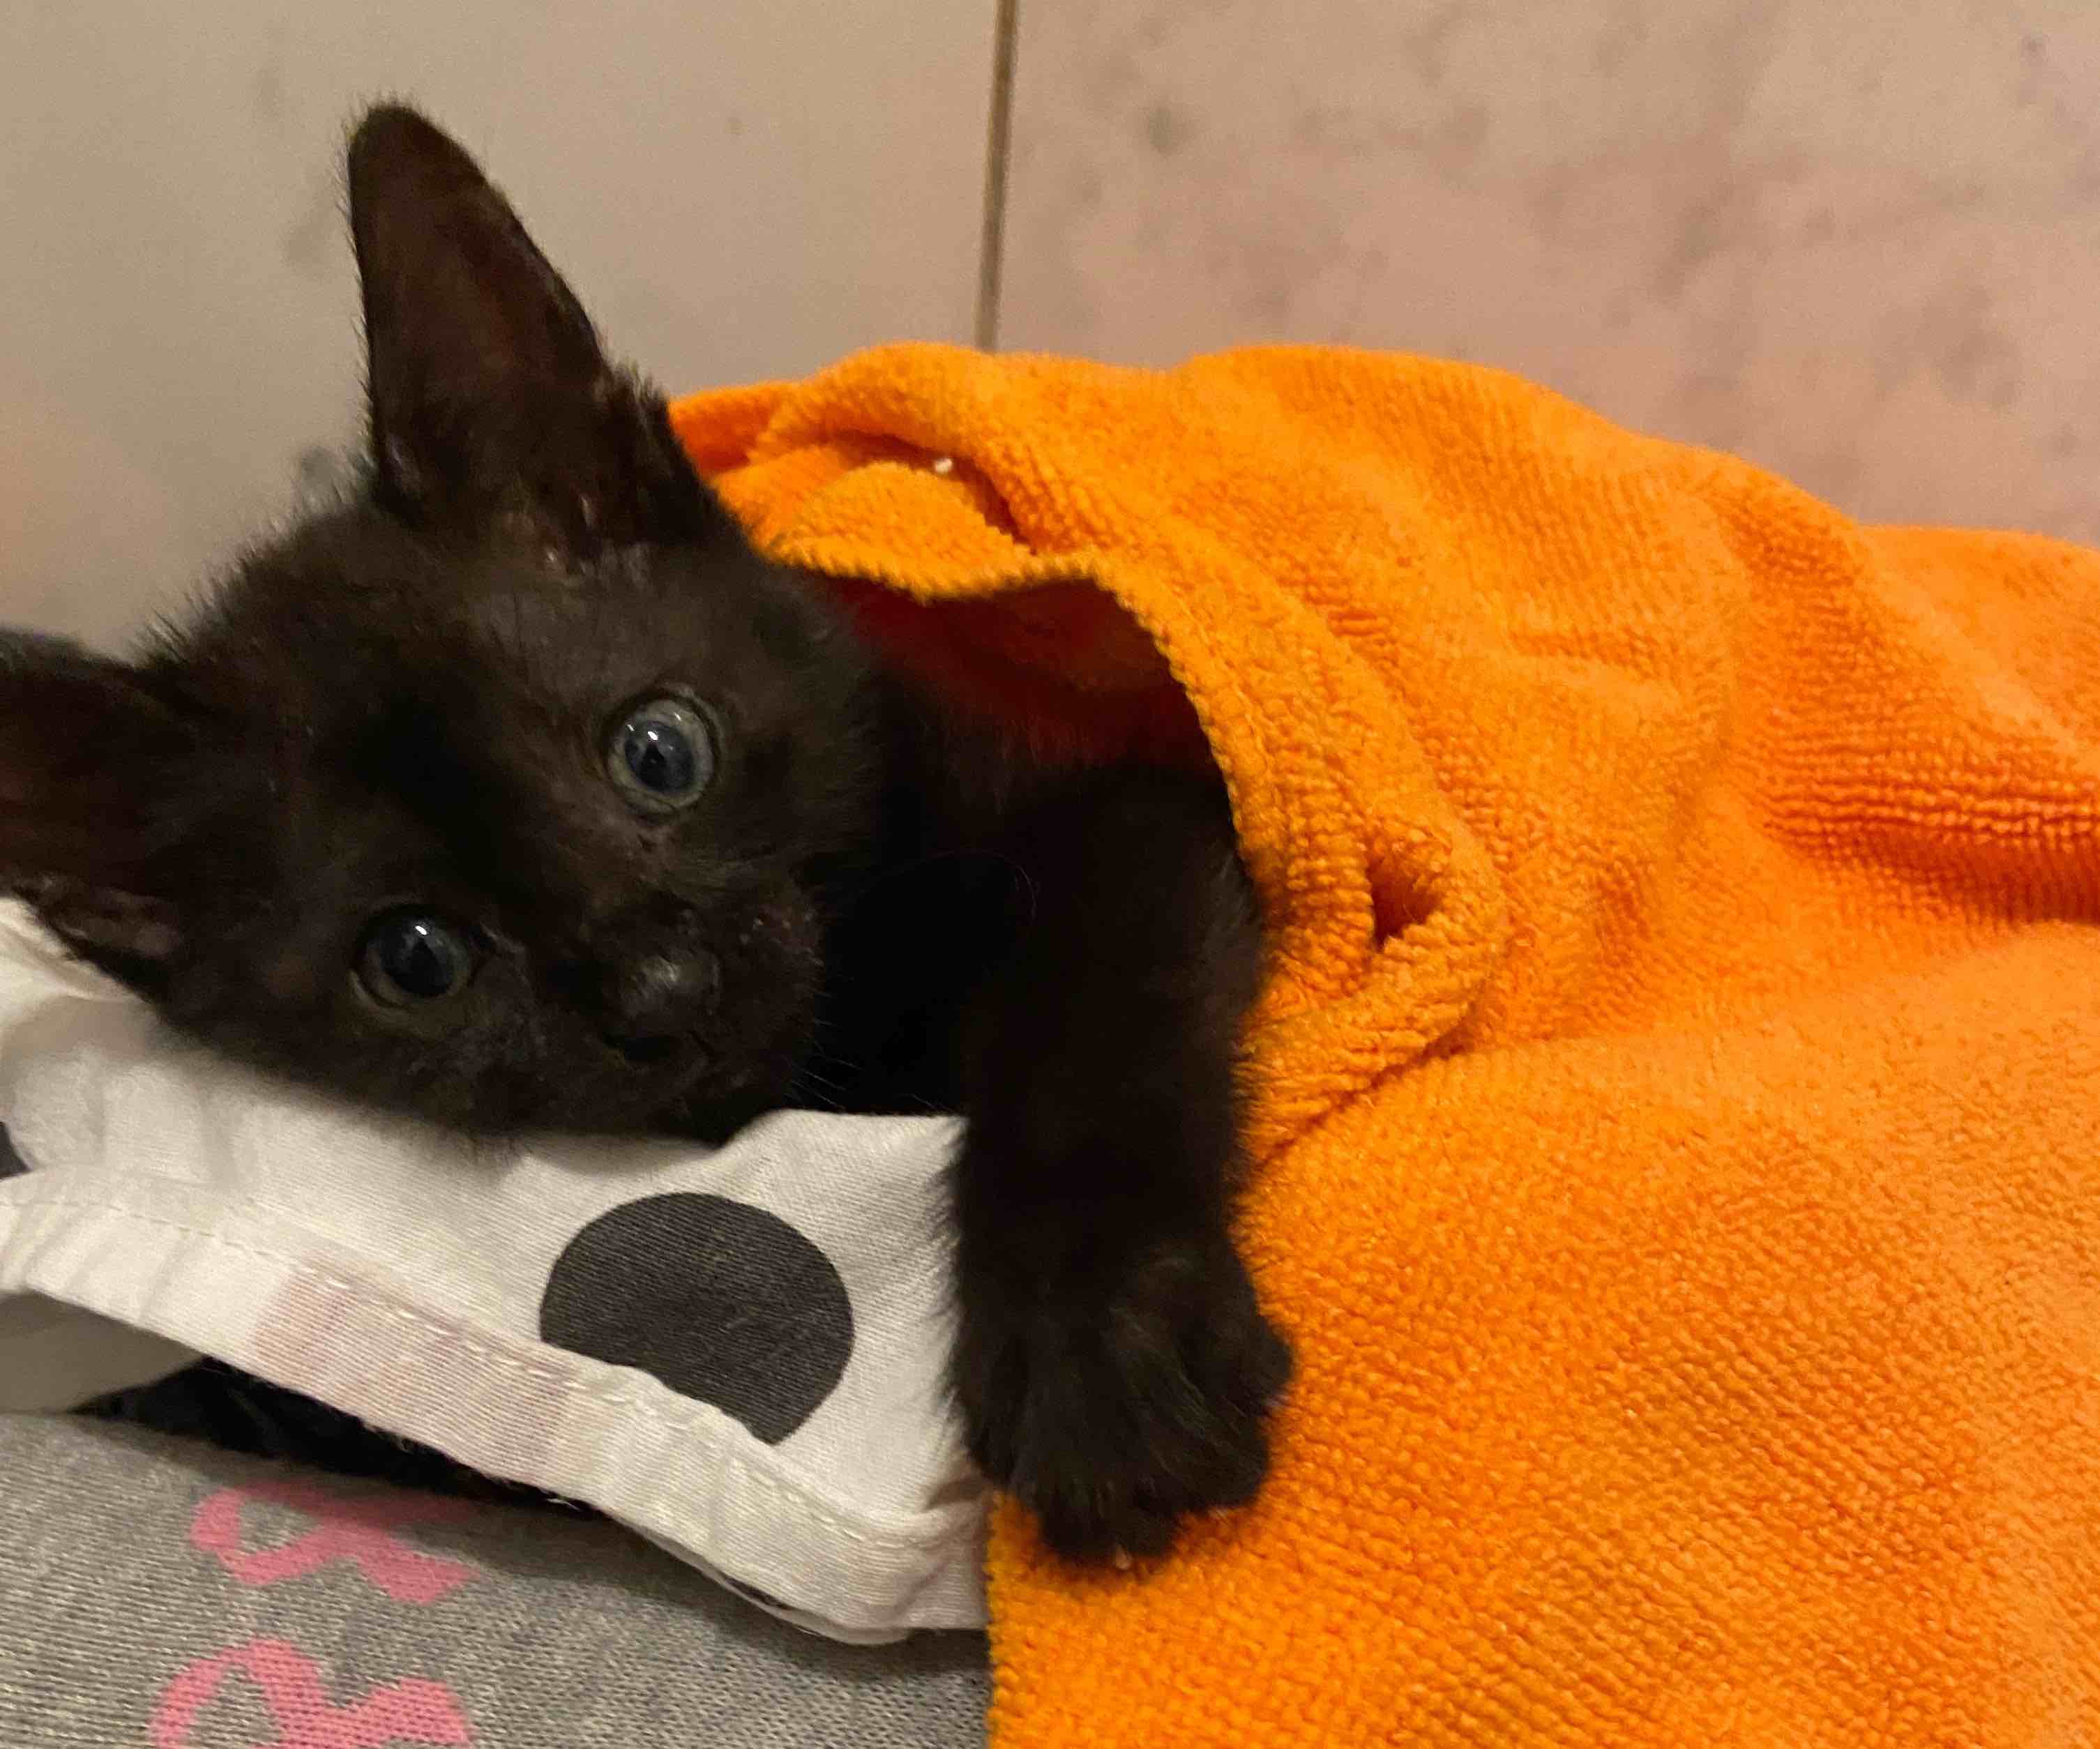
Cocoa the cat. Let the Internet karma flow in.
While simulation has been conducted for understanding urban cat population trends under different policies for controlling their growth, ranging from tragic kill programs to trap-hysterectomy/vasectomy-release programs, these projects were more focused on large population trends and used individual-based simulations where individuals (here, cats) could change status after a time increment of a day probabilistically, heeding unintuitive parameters. We wanted to explore the viability and usefulness of using agent-based modeling for understanding how urban cat populations grow/decline, affect other species like rats and birds, and interact with their human neighbors. While cats can be great friends, and can help by serving as a counter to rat populations, they can also be a nuisance in terms of cat fights, unwelcome bathroom habits, and damaging bird populations.
Using the great agent-based modeling package Mesa in Python, we successfully developed our cat simulation to include semi-realistic movement, eating, fighting, sleeping and mating patterns for cats, interaction with rat populations, cats consuming food offered by human households and possibly being struck by cars in streets, as well as the possibility of an abstract policy of “removing” cats in accordance with a fixed frequency (for example, remove one stray cat from the area per month). Not only was our modeling viable, but if refined to add additional policies for controlling cat populations, learned rather than programmed behaviors, impact on bird populations, etc. this testbed offers the chance to better understand the benefits and costs of outdoor cats in urban areas.
FeudalAI
Date: April-May 2022
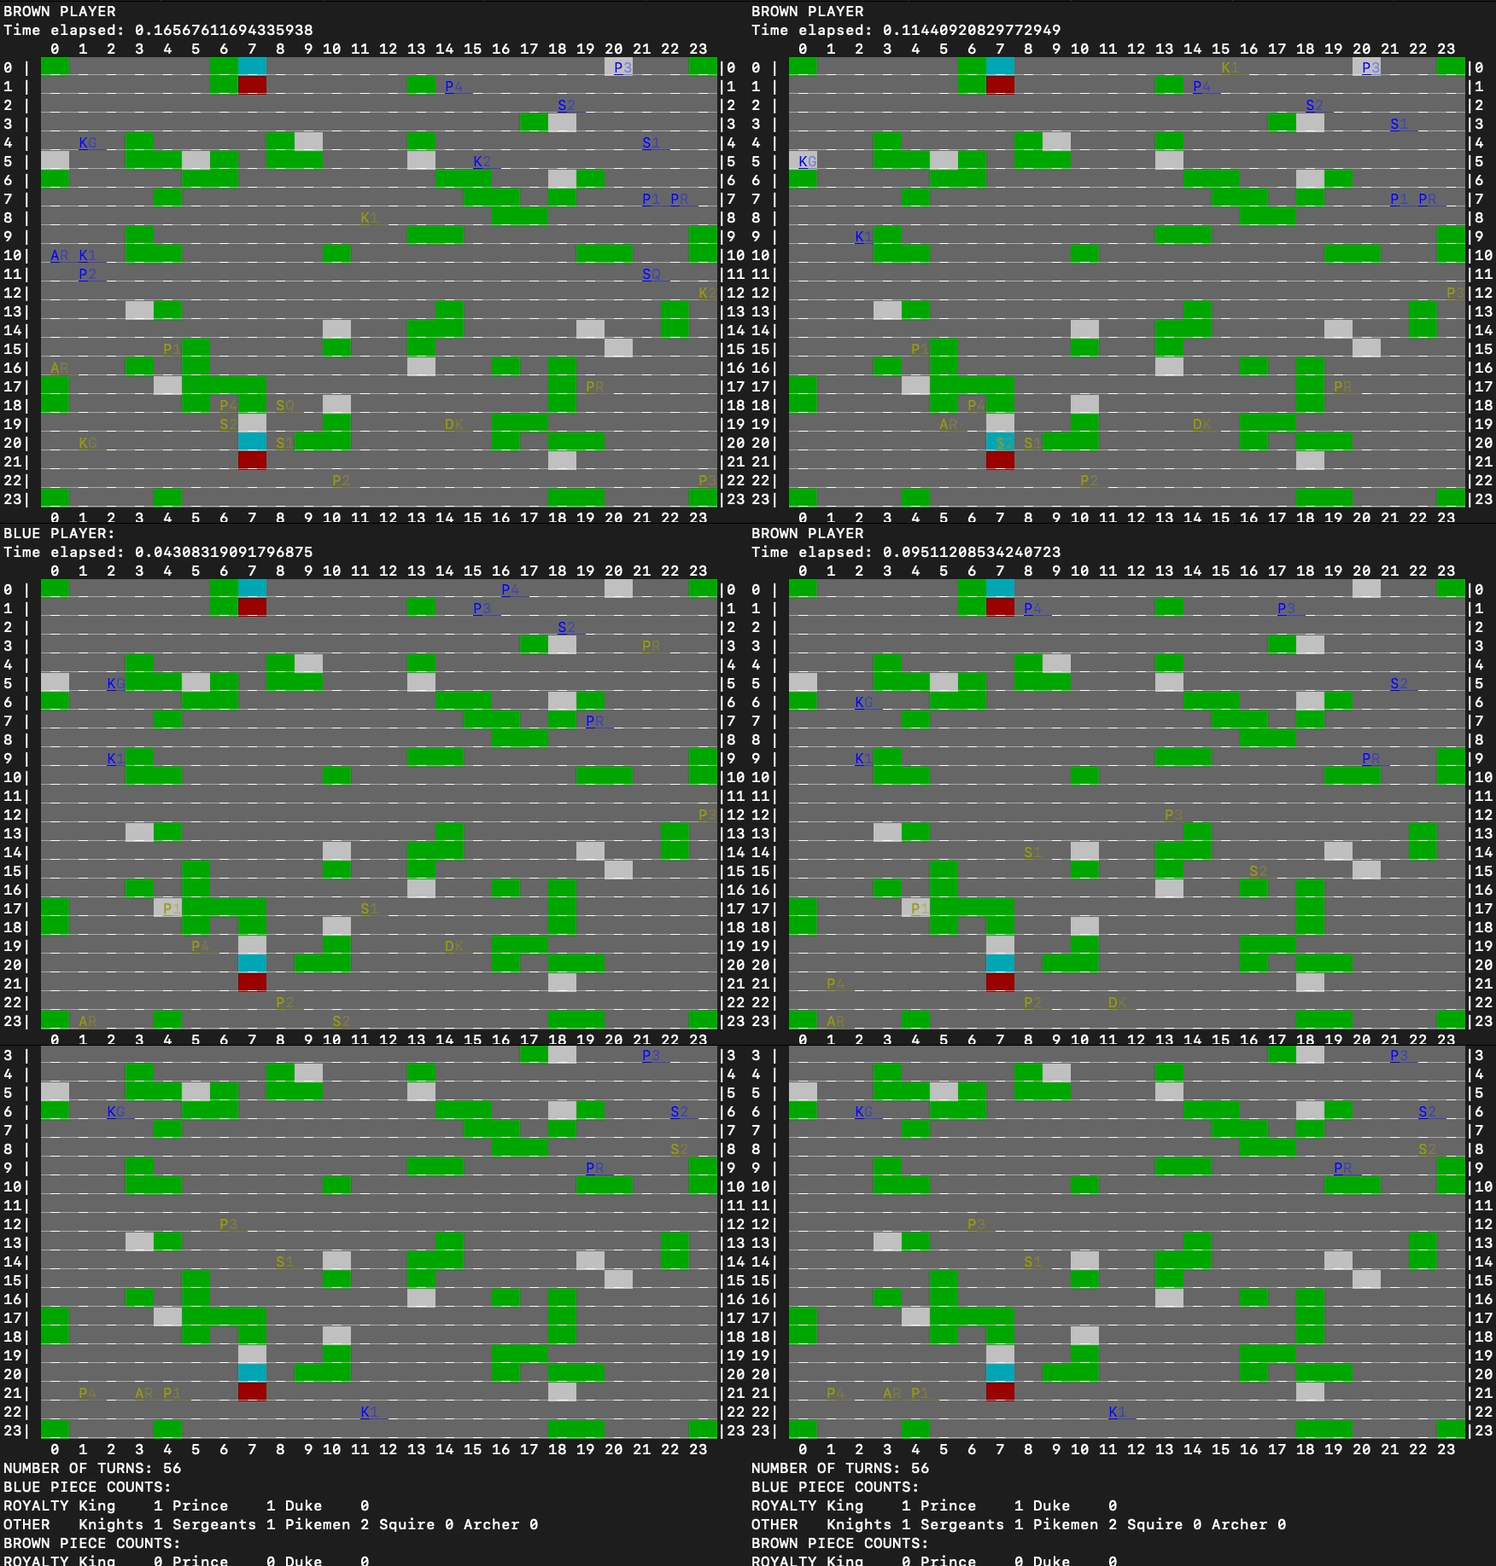
A screenshot of an initial setup in Feudal. There are two players, Blue and Yellow, a variety of piece types denoted by two symbol identifiers (e.g. Knight 1 = K1 or Pikemen 4 = P4), a castle for each player (Cyan = the castle green/entrance, Red = heart of the castle) and terrain which makes the game more complex than Chess (green = mountains, white = rough terrain). A basic terminal app sufficed for our AI focus, so it’s not quite Call of Duty.
Do you think Chess or Go are too easy? Well boy do I have the game for you. For the artificial intelligence course final project, I teamed up with my good friend Artjom to work on creating AI for the board game Feudal, a Chess-like game (see Feudal on Wikipedia) with a number of different complications: an initial piece placement phase (unlike the predetermined setup in Chess), a wide variety of piece types and movement patterns, terrain which can restrict attack and defense, the presence of castles which can be captured by the enemy to win the game, as well as the possibility of moving up to ALL of your pieces in a single turn. The last component (read as enormous branching factor) was certainly going to complicate our plan to work up from search-based agents to reinforcement learning (RL) if there was time.
Ultimately we implemented game AI depending on two major components. First, we employed local search (hill-climbing and simulated annealing) for finding ideal initial piece placement by using some attack and defense heuristics; because we didn’t know how these heuristics should be weighted for a score, we created a score optimizer for good measure so as to determine more suitable weights. Second, we created tree-based search gameplay agents: a variant of minimax using transposition tables and alpha-beta pruning, and a variant of Monte Carlo Tree Search making use of truncated gameplay (for reasonable length simulations) and parallel simulations (observing how hundreds or even thousands of game simulations could be conducted in a few seconds was addicting). Both of these approaches would have benefited from using a language other than Python, but it enabled fast development and offered handy features like generators for generating the vast breadth of multi-piece moves before we finally focused on just single piece moves for our proof of concept. While we didn’t have the time to really get to an RL-based approach given the sheer breadth of work - we even wrote a gameplay viewer so we could play back AI games for review! - the project was a success and an absolute blast.
The Room Assignment Problem
Date: November 2021
For a presentation in Hunter’s Parallel Computing course, I created a demonstration of parallelizing solving the room assignment problem (assigning pairs of students to dorm rooms given a pairwise student “incompatibility matrix”) using simulated annealing local search, in C with Open MPI. For as much as we all tend to reach for Python for AI applications, it was really neat to see how a highly efficient and parallel implementation of this classic algorithm could be created so simply in C.
Road Surface Disparity Estimation
Date: May 2020

A disparity map of a roadway scene generated via stereo reconstruction, produced by our Python implementation of a recent algorithm tailored towards road surfaces. On the left are some trees, the middle is the road and there are cars parked off to the right.
For a final project in the computer vision course at Hunter College, my teammates and I wanted to work on something a) in the realm of “classical” computer vision and b) that was directly applicable in the NYC context. Aside from pizza, bagels and curse words, what else is NYC known for but potholes and that last one could be tackled by a vision algorithm designed for 3D reconstruction of roads using stereo cameras. The short version is we implemented ~1.5 of a chain of 3 papers which gradually developed a stereo approach, which the authors rightly argued is more sensical than more expensive equipment, and we were able to achieve useful disparity maps using Python and the OpenCV package. The unfortunate result was that, at least in our experience, the proposed algorithm was untenable in Python, taking far too long to be useful in generating larger 3D models of a road. However, this project is on my to-revisit list, as it’s possible we may have run into some issue in how we used OpenCV, and I’m curious if I can recreate it with better performance in Julia, a language that’s on my to-learn list (I guess I have a few lists to manage here…).
Synthesis
Date: March-May 2020
Isn’t that the most beautiful synthesis (cough-cough hence the name) of nature and technology you’ve ever seen? This monstrosity beauty is the automated garden, complete with paper towels in case of water tubes gone wild, we created, all controllable via the web or mobile app.
All Hunter College computer science students have to do a major capstone project to achieve their Bachelor’s degree, ideally one that spans multiple languages and technologies. For my group, it seemed what better way to achieve this breadth of work than by working with hardware and software; inspired by this video on an Arduino garden project, we decided to tackle the challenge of building an automated garden which could be monitored and controlled over the web or from a mobile app.
In our group of four students, I focused on the hardware-gardenware(?) side, which meant a combination of two platforms and two languages:
- An Arduino - programmed in, you guessed it, Arduino - for interacting with analog and digital sensors alike, as well a relay for controlling the more “high-powered” components, a lamp and a water pump.
- A Raspberry Pi running a Python script to a) talk with / control the Arduino, b) talk with the backend server, and c) of course, take pictures with the attached camera, because who doesn’t want an instant snapshot of their plants on demand?!
I had tinkered with Arduino before this project, and working with hardware, from water pumps to robotic arms, is always exciting, but something about watching our groupmate request watering from the mobile app, and watching the pump kick on in my house, was simply magical.